Performance statistics
The QCG-PilotJob service provides tools which, based on service logs, allow you to analyse the efficiency of resource use. Please note that the current implementation is the first version of these tools and may not be free from errors.
Performance measurements and data collection
Due to the potential load on the QCG-PilotJob service and its asynchronous nature, in order to accurately measure its performance it is necessary to use external metrics to determine when a particular job started and ended. In order to generate such metrics, a wrapper program was created in the C language. The role of this program is to register the moment when the application indicated by the arguments started, and to register the moment when it ended. The collected data is sent through a named pipe (data sent through such a communication channel is not stored in the file system, so the file system performance does not affect the efficiency of communication) to the QCG-PilotJob service agent running on the local compute node. When all calculations are completed, the collected data are written to the QCG-PilotJob service logs.
Note that currently all parallel tasks (requiring more than one core) are started using the “srun” command (provided by the Slurm queue system). Therefore, the wrapper used with the “srun” command will register the moment the “srun” command itself is run, and not the target processes of the parallel application. Therefore, please note that the metrics and analysis presented here do not take into account the latency of the queueing system itself
Wrapper installation
As the wrapper itself is written in C, it requires compilation on the target computing cluster.
Source code (qcg_pj_launch_wrapper.c) can be downloaded from the develop branch of QCG-PilotJob project repository on
GitHub, e.g:
$ wget https://raw.githubusercontent.com/vecma-project/QCG-PilotJob/develop/utils/qcg_pj_launch_wrapper.c
and then compiled using the compiler of your choice:
$ gcc -Wall -o qcg_pj_launch_wrapper qcg_pj_launch_wrapper
or
$ icc -Wall -o qcg_pj_launch_wrapper qcg_pj_launch_wrapper
The compiled program should be placed in a path accessible from all compute nodes.
Launch of QCG-PilotJob service with collection of external metrics
In order to collect external metrics related to application execution time, two arguments must be passed when starting the QCG-PilotJob service:
--enable-rt-stats- enabling the collection of statistics--wrapper-rt-stats- indication of wrapper location (the path to the installed wrapper program)
An example call to the QCG-PilotJob service with the job description placed in a JSON file and the collection of external metrics looks like this:
$ qcg-pm-service --wd out-dir --file-path mpi_iter_mixed.json --enable-rt-stats --wrapper-rt-stats /home/piotrk/runtime_wrapper/qcg_pj_launch_wrapper
In this case, all logs and metrics will be in the ‘out-dir’ subdirectory when the calculation is complete.
Analysis tool - qcg-pm-report
The QCG-PilotJob package provides a qcg-pm-report program to enable performing a number of analyses based on the data collected by the wrapper and available in a working directory after the QCG-PilotJob’s run. It allows to assess the performance of the entire workflow, elementary tasks as well as to get information about resources utilisation.
A description of the available commands of qcg-pm-report is given below.
stats
The stats command displays basic metrics about the executed workflow as a whole, such as:
total jobs,failed jobs- number of running jobs and number of failed jobstotal cores,total nodes- number of available nodes and total number of available cores on all nodesservice started,service finished,service runtime- the start and end time of the QCG-PilotJob service and the difference between these dates; note that the start time of the QCG-PilotJob service may be slightly delayed with respect to the start time of the job in the Slurm service, as the time reported by the queue system does not take into account the time associated with loading the Python environment and the QCG-PilotJob service modules; in practice, however, this difference should not be greater than 1-2 seconds.init overhead,finish overhead,total overhead- these are respectively the time markups for the initiation of the QCG-PilotJob service (the time from the start of the service to the start of the first job within it), the finish time of the QCG-PilotJob service (the time from the end of the last job within it to the end of the QCG-PilotJob service) and the sum of the two previously mentionedoverhead ratio- the ratio oftotal overheadtoservice runtimeoverhead core-hours- it is a product of available cores andtotal overheadvalue (expressed in hours)
An example of a generated report:
$ qcg-pm-report stats out/intelmpi-mpi-iter-mixed-large-10128902/
                                   total jobs: 2000
                                  failed jobs: 0
                                  total cores: 960
                                  total nodes: 40
                          service started: 2021-04-14 14:20:08.223523
                         service finished: 2021-04-14 14:23:21.028799
                          service runtime: 192.81 secs
                                init overhead: 4.08 secs
                          finish overhead: 1.57 secs
                           total overhead: 5.65 secs
                           overhead ratio: 2.9
                  overhead core-hours: 1.51
launch-stats
The launch-stats command is used to generate a report showing delays in launching and recording the completion of jobs by the QCG-PilotJob service. The following metrics are generated:
total start overhead- total (for all jobs) time difference between starting the job by the QCG-PilotJob service and the actual start of the job (information registered by the running wrapper), expressed in secondstotal finish overhead- total (for all jobs) difference in time between the actual finish of the job (information registered by the running wrapper) and the moment when it was registered by the QCG-PilotJob service, expressed in secondstotal start and finish overhead- sum of the two previous metricsaverage job start overhead- average delay in starting a single jobaverage job finish overhead- average delay in handling the completion of a single jobaverage job total overhead- average total delay in starting and handling the completion of a single jobaverage real job run time- average real run time of a single job (determined by metrics sent by wrapper)average qcg job run time- average duration of a single job (determined from the times recorded by the QCG-PilotJob service)average job overhead per runtime- percentage ratio ofaverage job total overheadto theaverage real job run timegenerated for total jobs- the number of jobs for which a report was generated, i.e. the number of all jobs for which metrics were recorded (these were provided by the wrapper
An example of a generated report:
$ qcg-pm-report launch-stats out/intelmpi-mpi-iter-mixed-large-10128902/
                                                         total start overhead: 29.2834
                                                        total finish overhead: 62.1390
                                  total start and finish overhead: 91.4224
                                           average job start overhead: 0.0146
                                          average job finish overhead: 0.0311
                                           average job total overhead: 0.0457
                                                average real job run time: 16.5664
                                                 average qcg job run time: 16.6121
                         average job overhead per runtime (%): 0.29
                                                 generated for total jobs: 2000
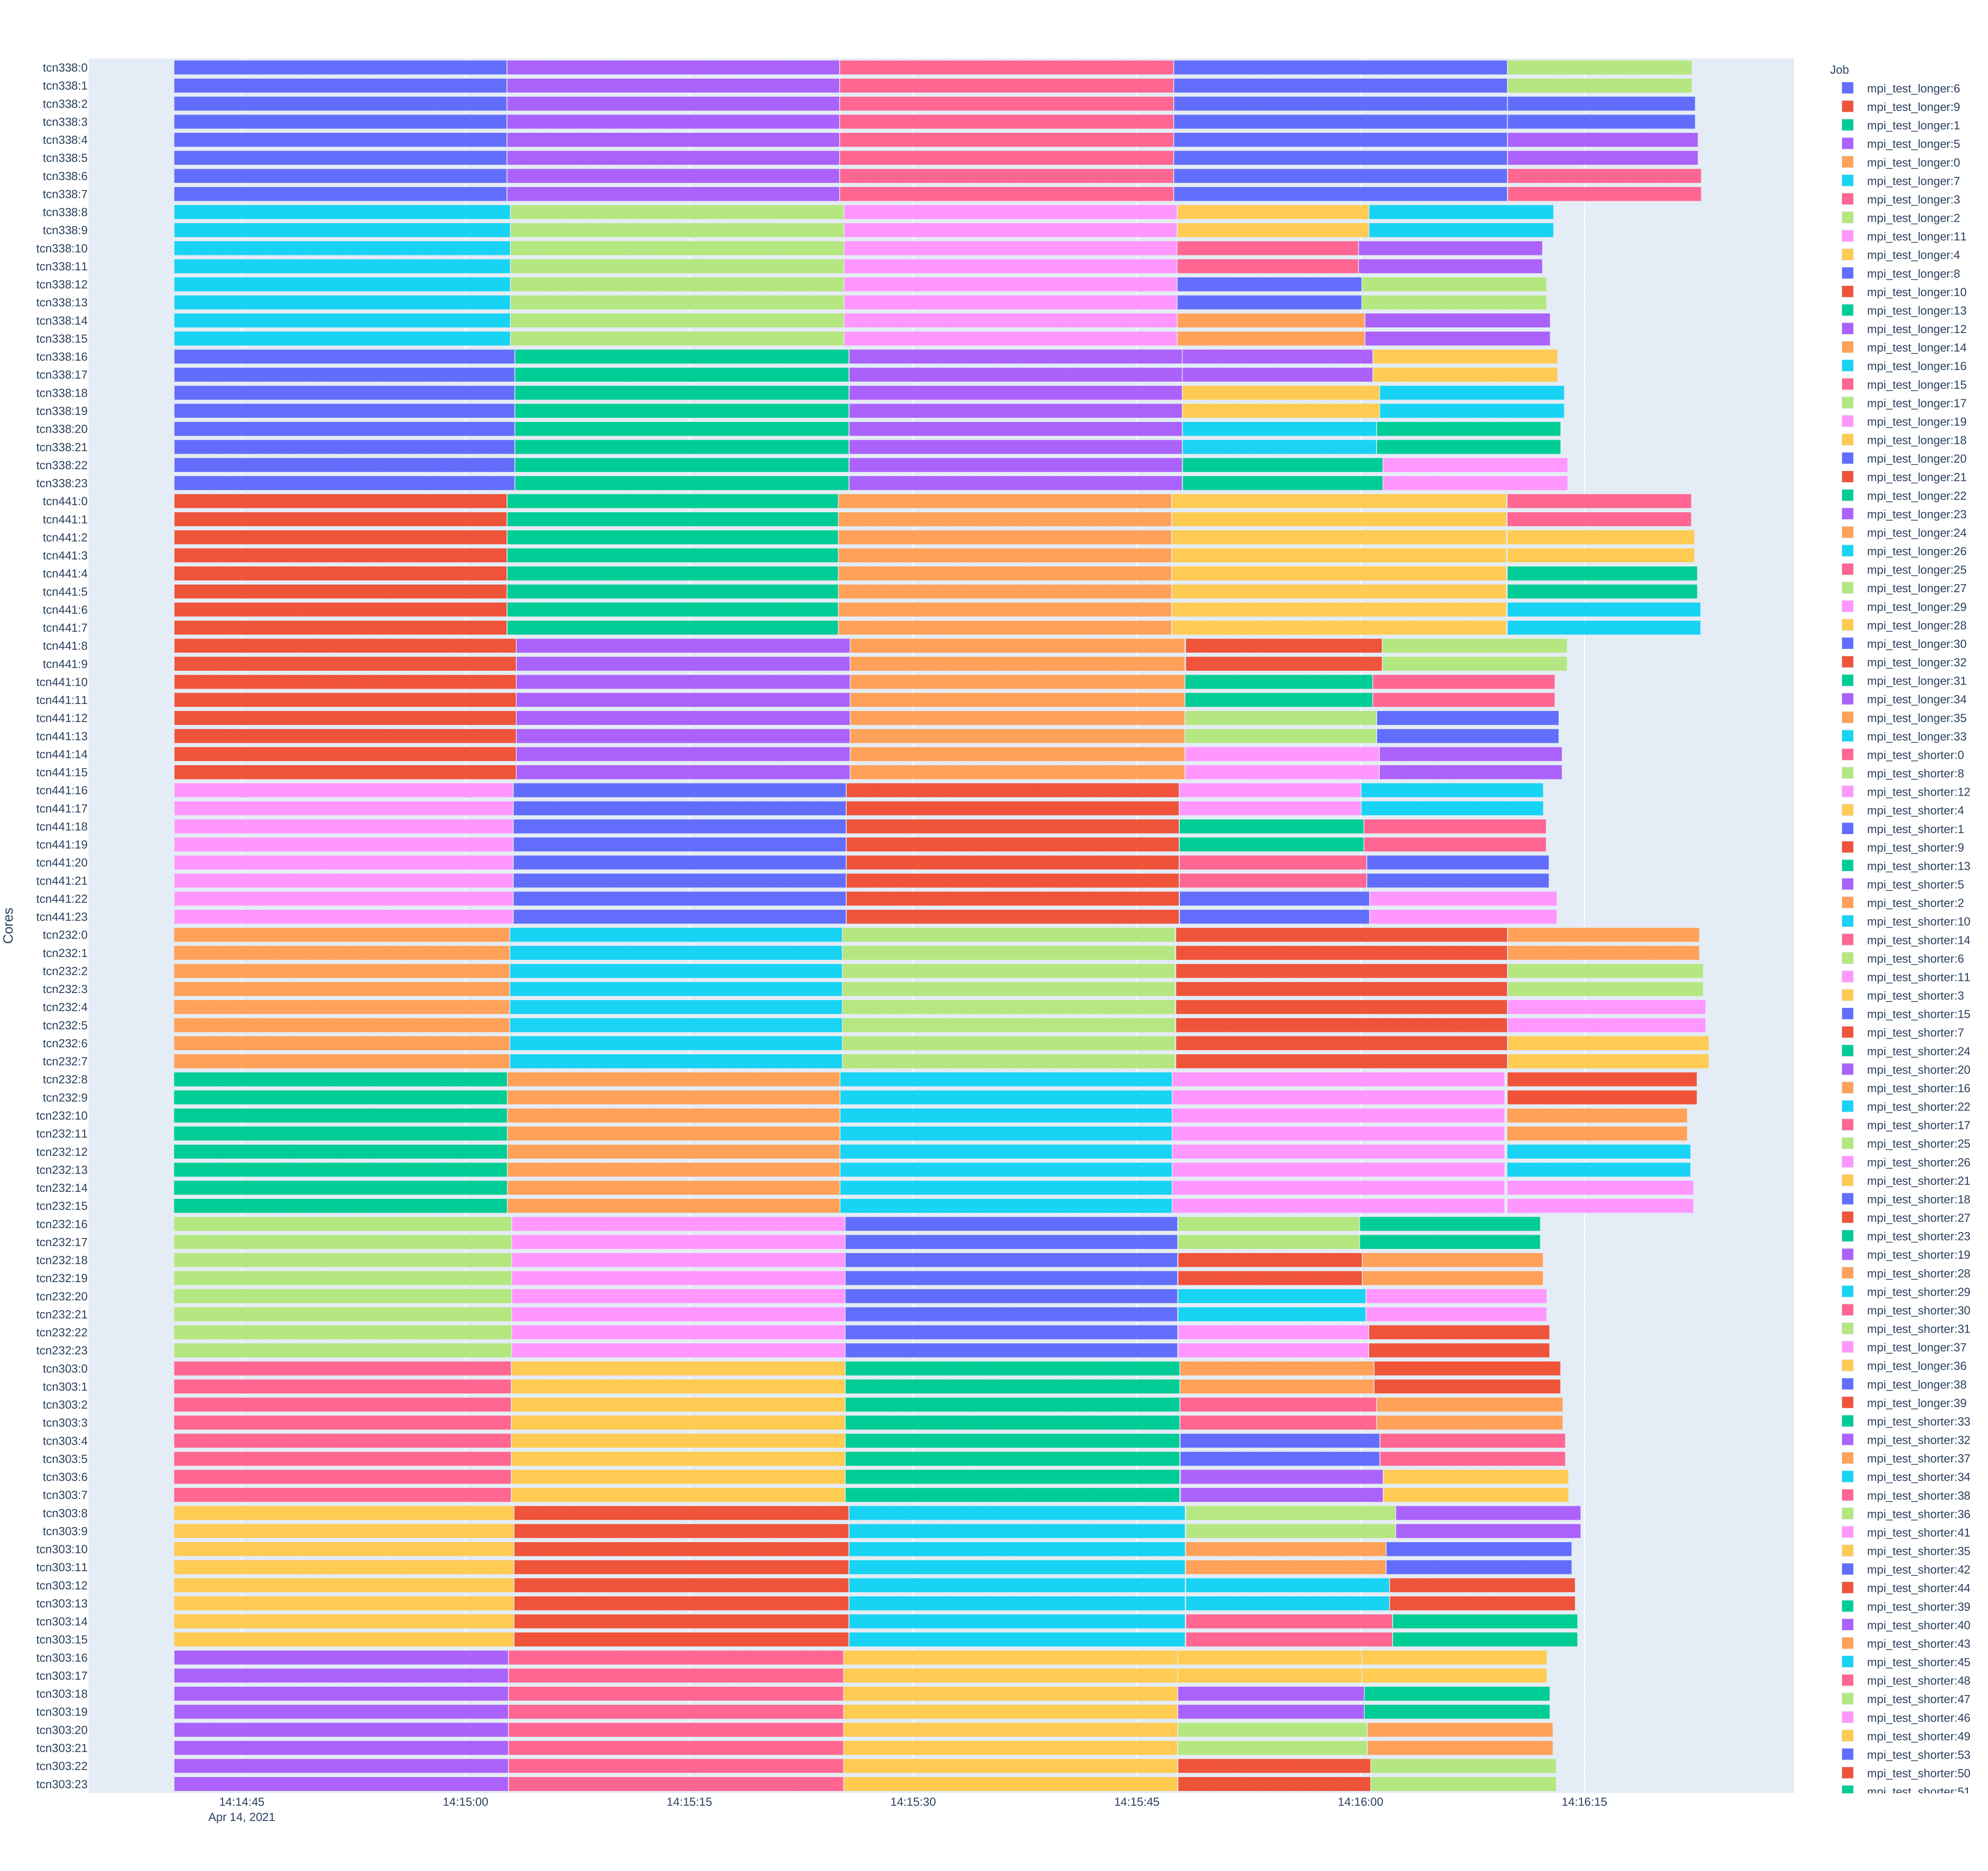
gantt
The gantt command is used to generate a timeline plot with the start and end
of each task running on the allocated resources marked. This plot shows an
overall view of the scheduling plan. In order to generate the plot, as an
additional argument, in addition to the path to the working directory of the
task, the name of the target file where the plot should be saved should be
given. Supported files include: pdf, png, jpeg. Note - the time to generate
the graph depends on the number of resources, the number of tasks and the
duration of the entire workflow, and for larger scenarios can be a
time-consuming operation. In case of a scenario running 2000 tasks on 960 cores
and 40 nodes, the graph generation may take up to 3 minutes.
Example of chart generation:
$ qcg-pm-report gantt out/intelmpi-mpi-iter-mixed-10128873/ gantt.pdf
A sample chart generated:
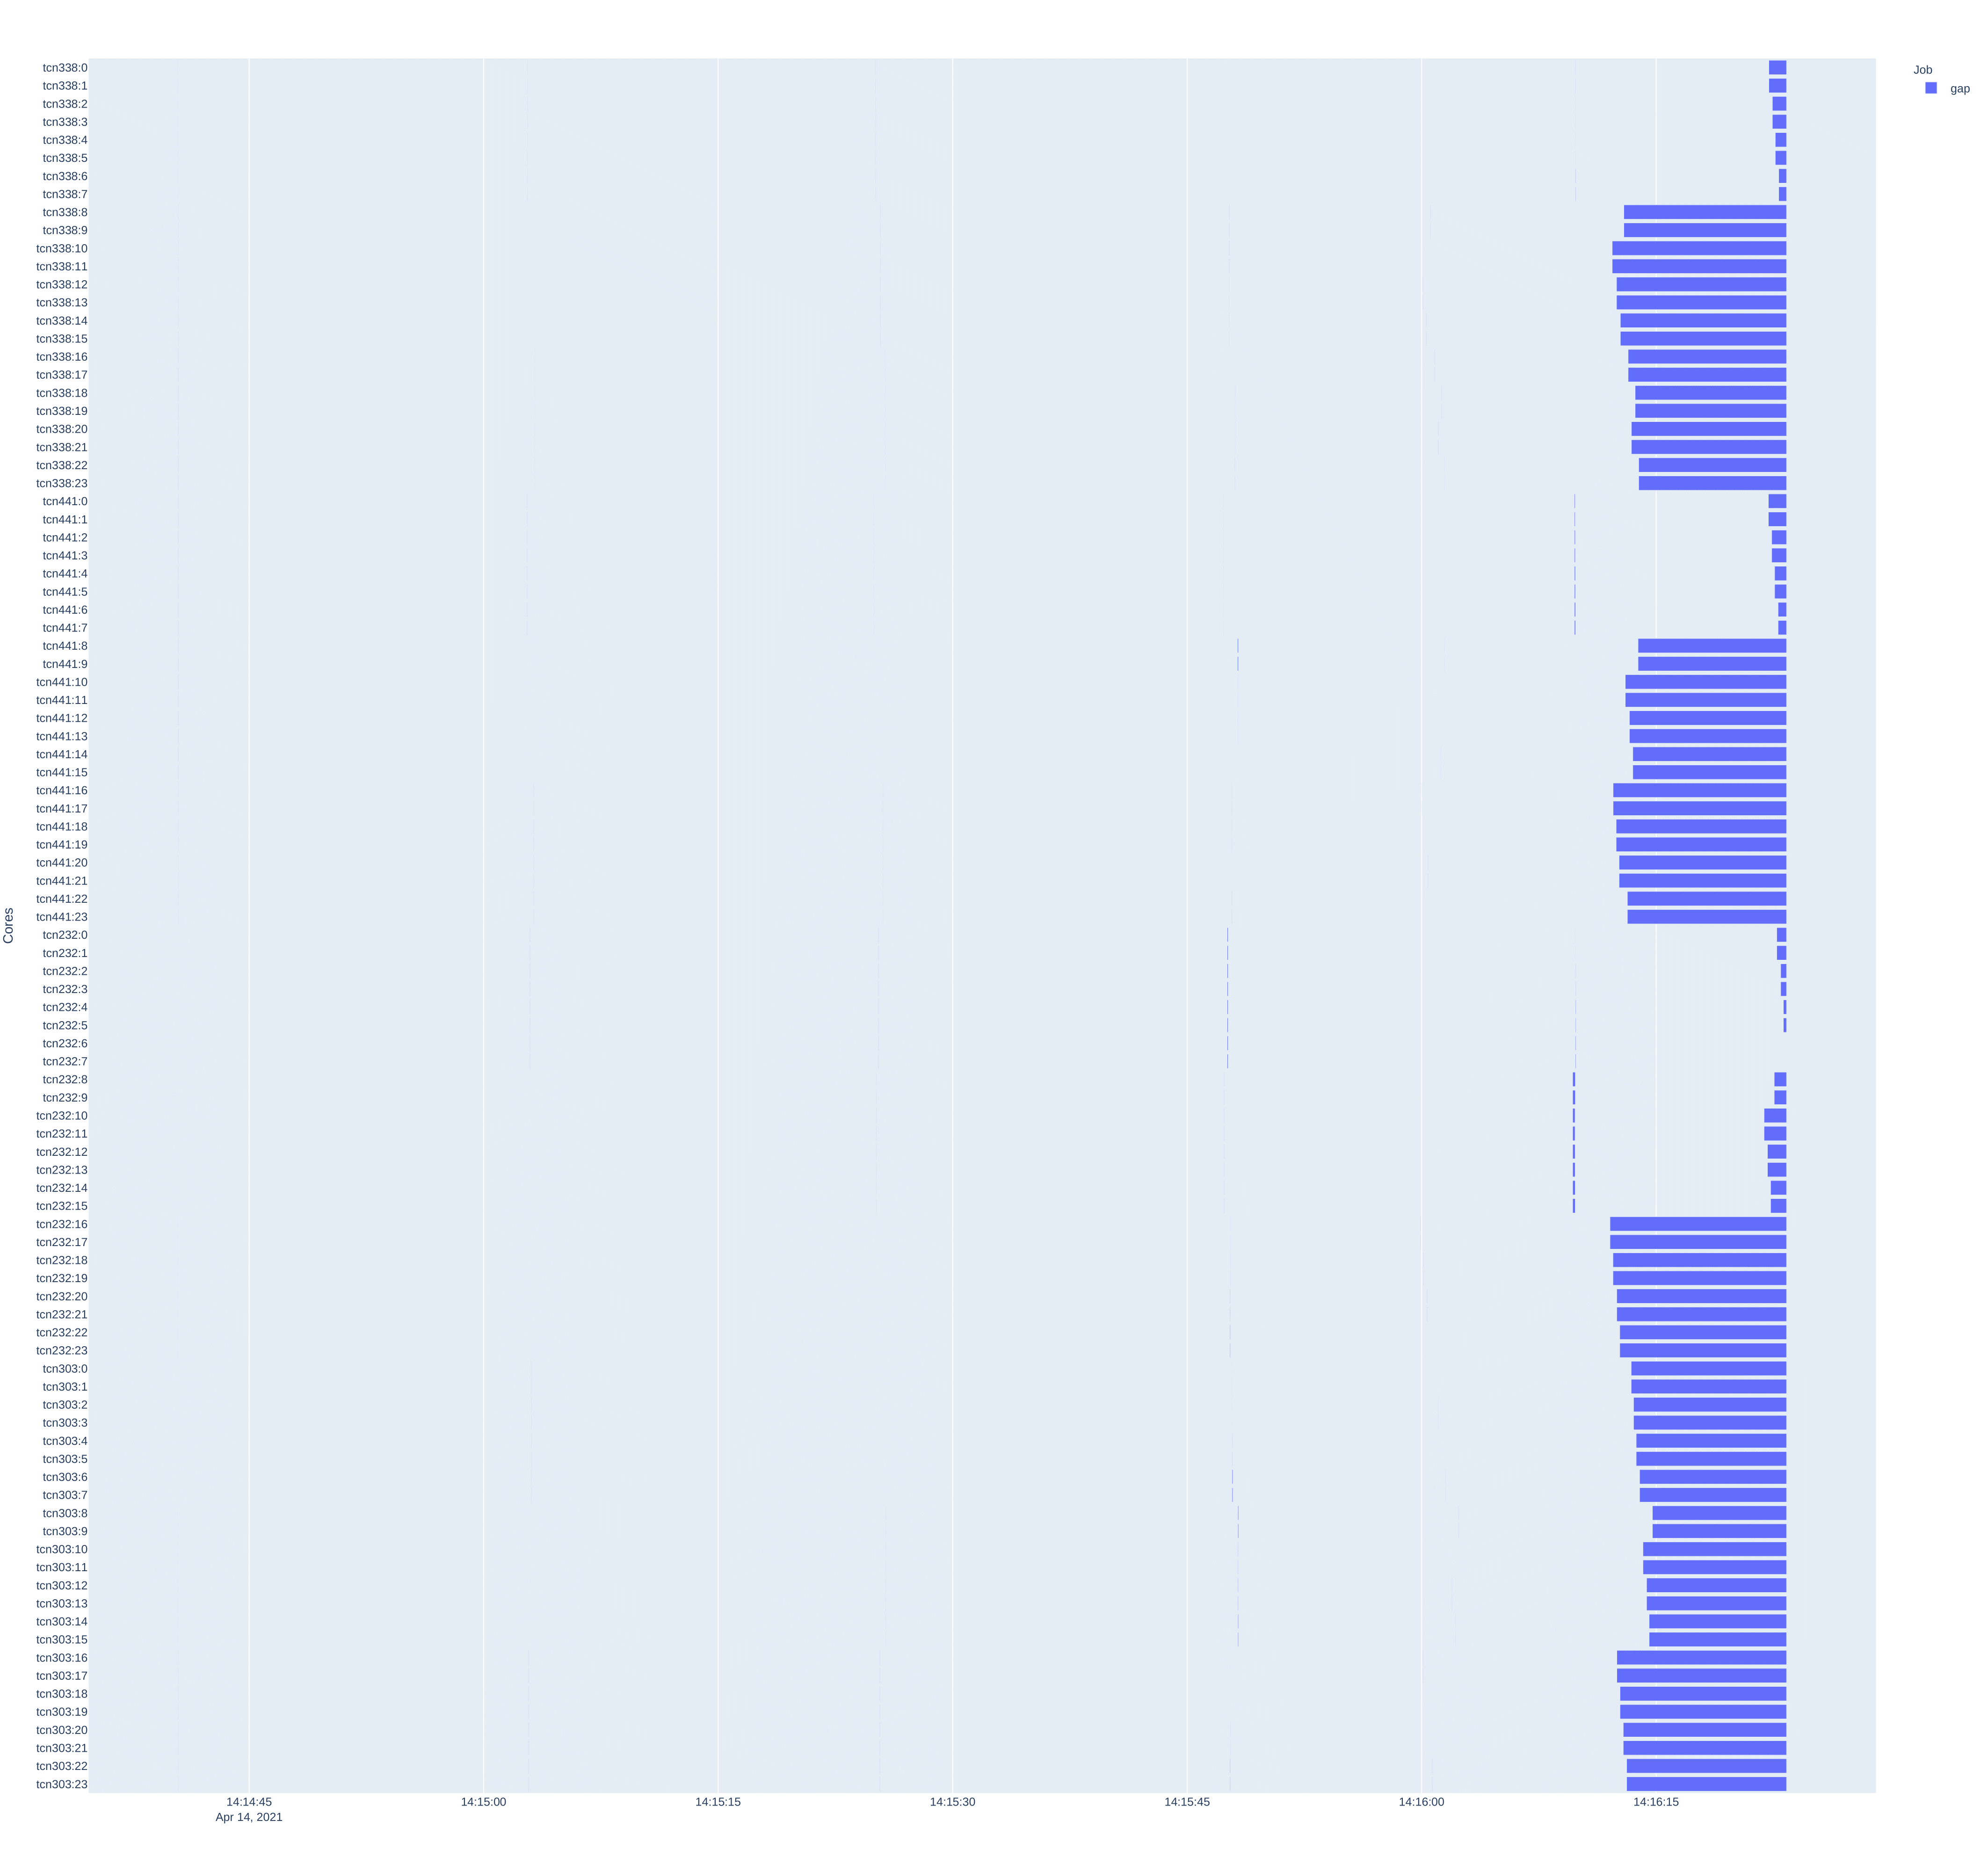
gantt-gaps
The gantt-gaps command is used to generate a timeline plot with marked
moments when resources were not used. This plot is in a way the negative of the
plot generated by the “gantt” command. As an additional argument, in addition
to the path to the working directory of the task, you should give the name of
the target file where the plot should be saved. The following files are
supported: pdf, png, jpeg. Note - the time to generate the graph depends on
the number of resources, the number of tasks and the duration of the entire
workflow, and for larger scenarios can be a time-consuming operation. In the
case of a scenario running 2000 tasks on 960 cores and 40 nodes, graph
generation can take up to 3 minutes.
Example of chart generation:
$ qcg-pm-report gantt-gaps out/intelmpi-mpi-iter-mixed-10128873/ gantt-gaps.pdf
A sample chart generated:
rusage
The rusage command is used to generate a report showing the usage of available resources. In the basic version, it displays two metrics:
used cores- number of cores on which tasks were runningaverage core utilization (%)- percentage core utilization, it is calculated as the average value of the percentage utilization of a single core (on which at least one task was running)
The single core utilisation percentage is calculated as the ratio of the time
during which a job was actually running on a given node (based on metrics sent
by the wrapper) to the total time of running the QCG-PilotJob service (see
service runtime in the stats command).
An example of a generated report:
$ qcg-pm-report rusage out/intelmpi-mpi-iter-mixed-large-10128902/
                               used cores: 960
             average core utilization (%): 94.2%
Running the rusage command with the --details parameter will list the
usage percentages for each core.
For example, a generated report containing details:
$ qcg-pm-report rusage --details out/intelmpi-mpi-iter-mixed-large-10128902/
                               used cores: 960
             average core utilization (%): 94.2%
 tcn1261
         0    : 95.9%, unused 7.8734 s
         1    : 95.9%, unused 7.8734 s
         2    : 96.1%, unused 7.4926 s
         3    : 96.1%, unused 7.4926 s
         4    : 96.2%, unused 7.3733 s
         5    : 96.2%, unused 7.3733 s
         6    : 90.0%, unused 19.3723 s
         7    : 90.0%, unused 19.3723 s
         8    : 90.4%, unused 18.5259 s
         9    : 90.4%, unused 18.5259 s
         10 : 90.1%, unused 19.0094 s
         11 : 90.1%, unused 19.0094 s
         12 : 90.3%, unused 18.7818 s
         13 : 90.3%, unused 18.7818 s
         14 : 90.3%, unused 18.7562 s
         15 : 90.3%, unused 18.7562 s
         16 : 95.4%, unused 8.8197 s
         17 : 95.4%, unused 8.8197 s
         18 : 95.5%, unused 8.6833 s
         19 : 95.5%, unused 8.6833 s
         20 : 95.6%, unused 8.5297 s
         21 : 95.6%, unused 8.5297 s
         22 : 95.8%, unused 8.0063 s
         23 : 95.8%, unused 8.0063 s
(due to the length of the report, data for one computational node only are included).
efficiency
Command efficiency is used to show the percentage of resource usage,
excluding the time when the resource was inactive due to a scheduling plan.
Resource usage time is counted as time when any task was running or when
another task was waiting for another resource to free up. The efficiency metric
only takes into account delays due to QCG-PilotJob’s job launching and
termination handling.
An example of a generated report:
$ qcg-pm-report efficiency out/intelmpi-mpi-iter-mixed-large-10128902/
                       used cores: 960
     average core utilization (%): 99.6%